Projects
NYC Graffiti
To be a better Product Manager, I wanted to increase my knowledge of how a tech-stack works together, learn its limitations, use real data to support or disprove a hypothesis, and visualize said data in an easy, consumable way. Here is what I did to get here.
I noticed the same graffiti along my daily commute for the past 2 years and I wondered if people every reported it and if NYC actually cleaned it up. My guess was people do report it but the city doesn't really care about it. Next, I pulled NYC's open source data on graffiti reports from April 2015 - May 2016. I taught myself a bit of SQL to parse the data in various ways to see if it supported or refuted my hypothesis.
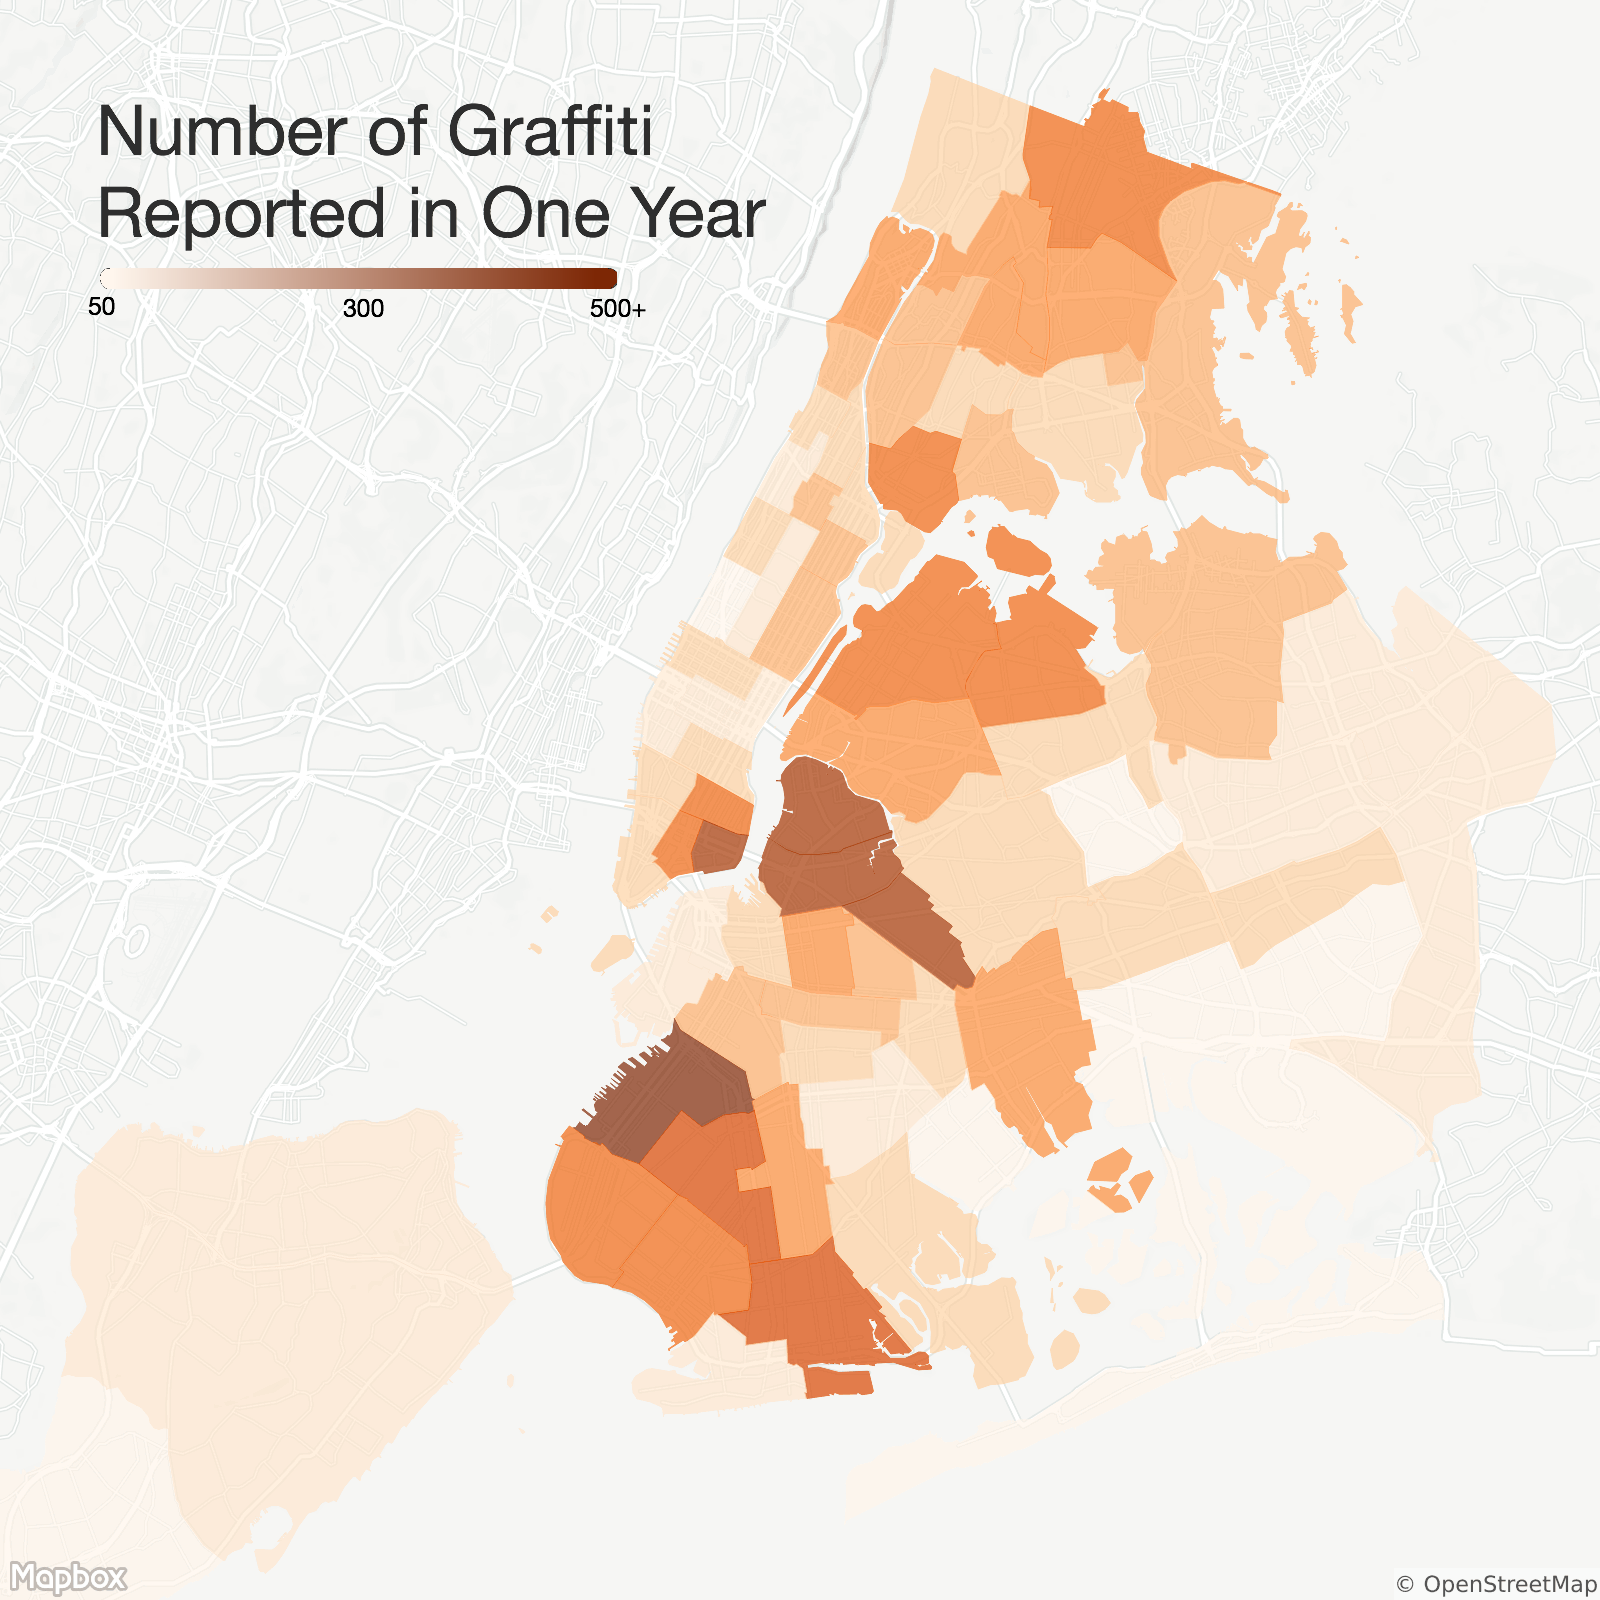
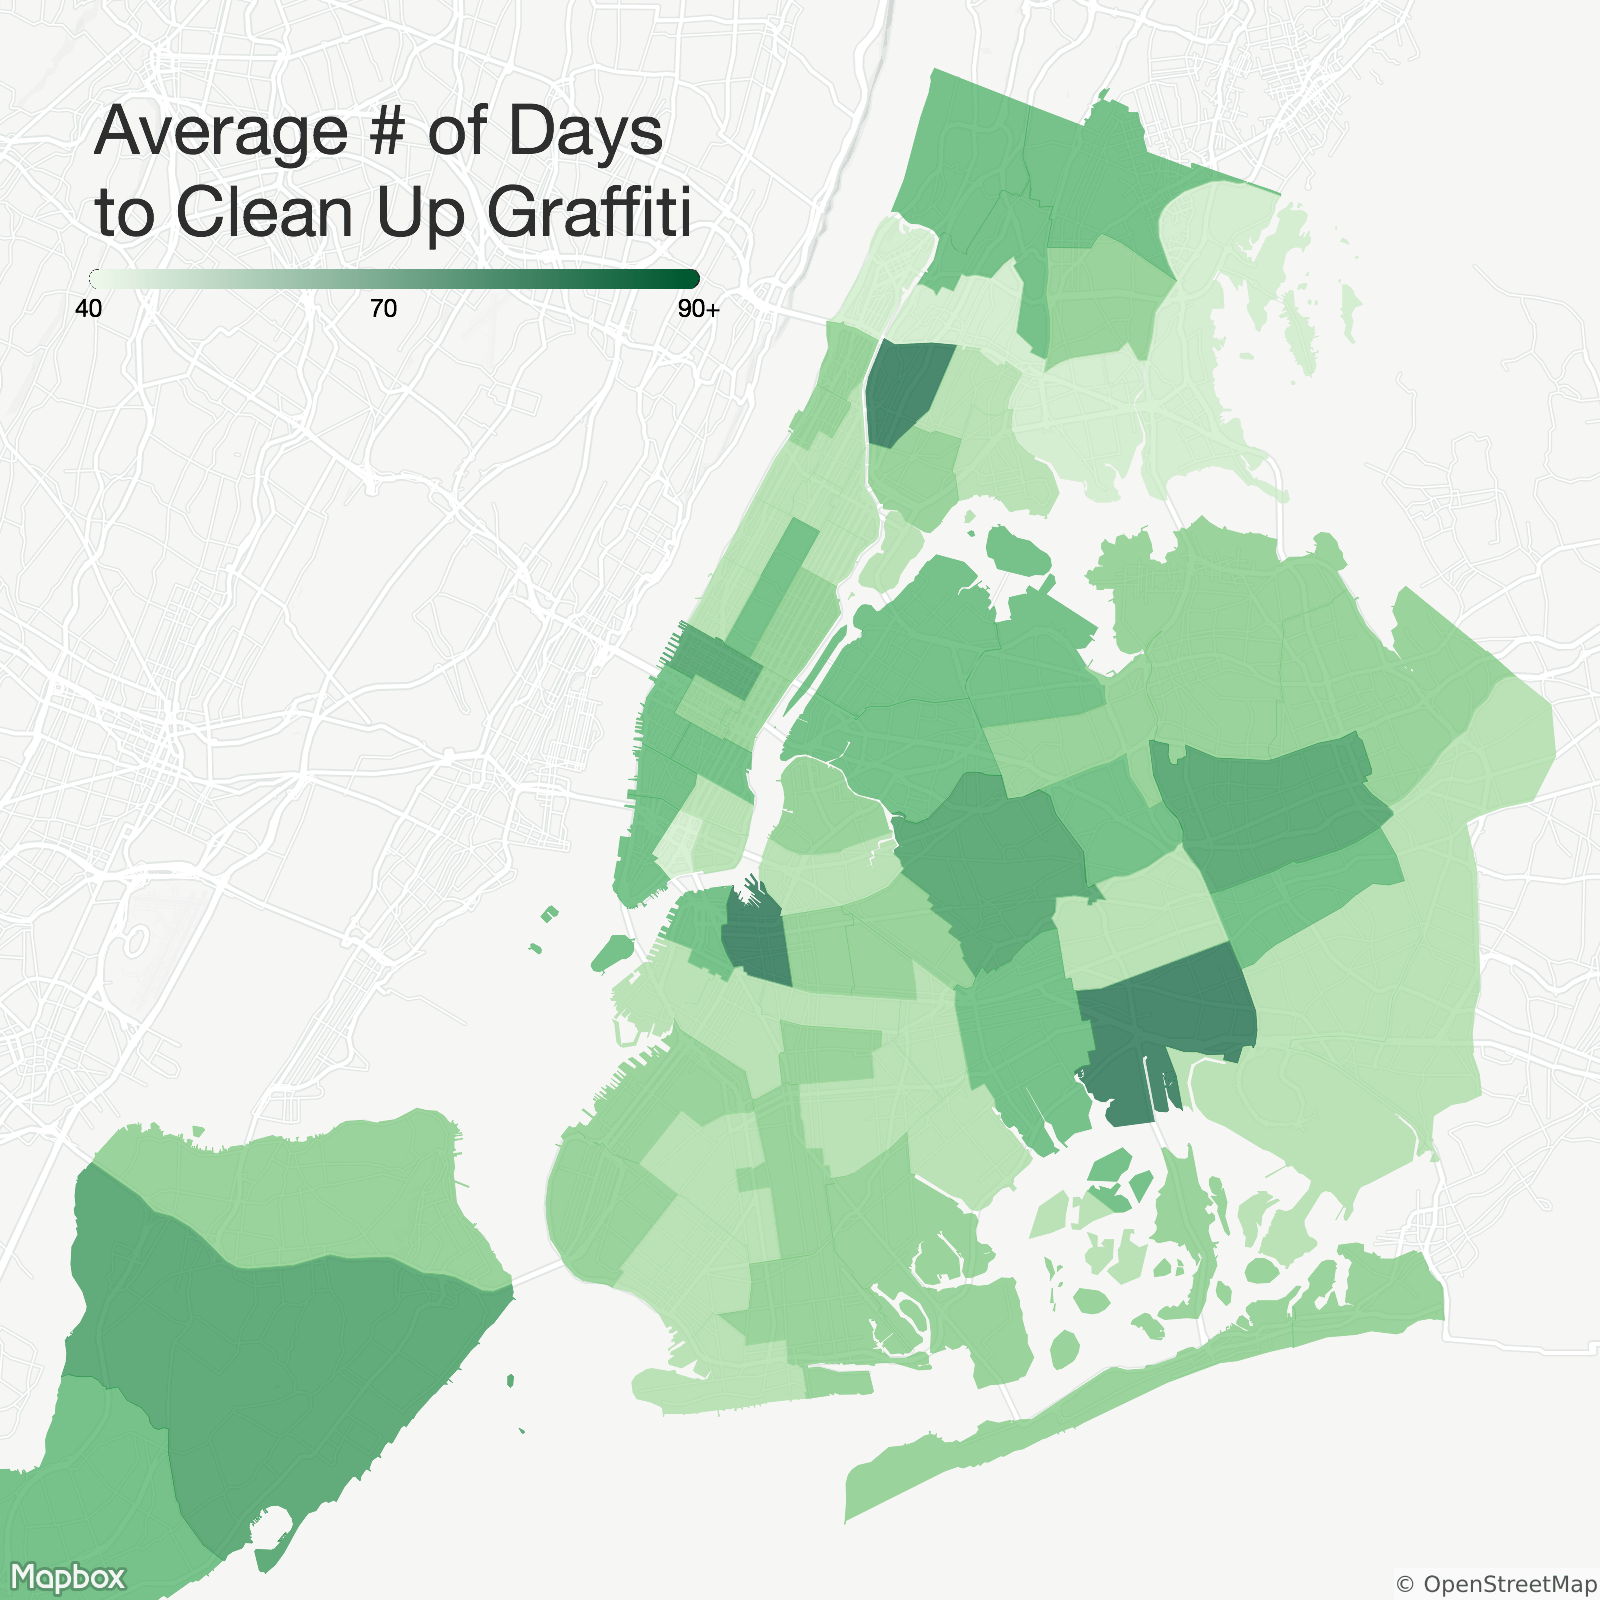
Once I discovered some interesting trends, I used mapbox.com to visualize it. This led me to learning how to create .json files, a better understanding of how vector maps work, and familiarizing myself with a little bit of JavaScript.
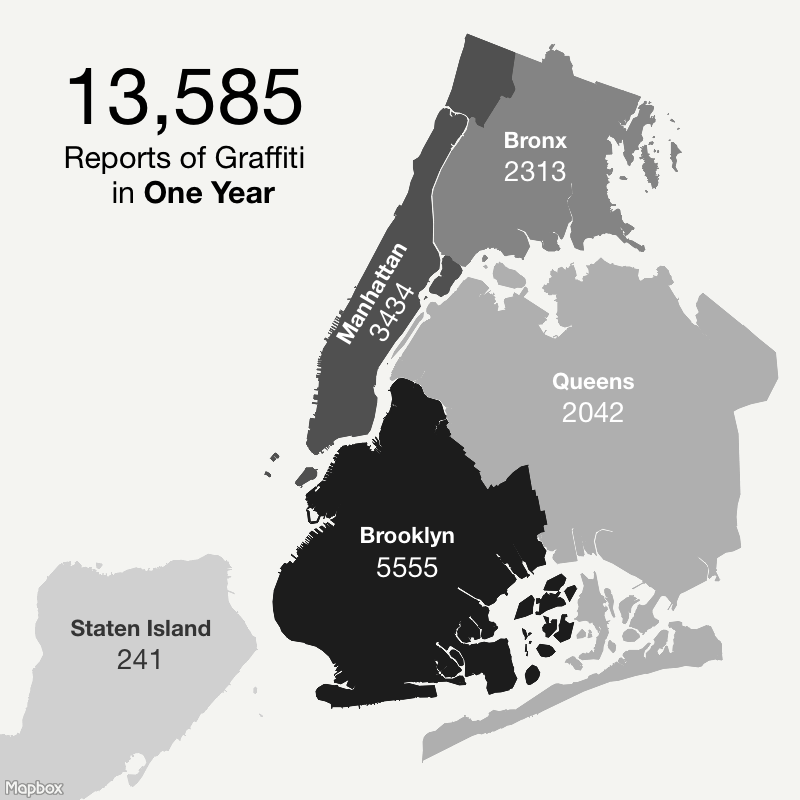
After I created the maps below, I concluded that of the 13,585 reports of graffiti in one year, 59% of those reports were cleaned up before the police precinct's average number of days to clean.
In short, people do report graffiti and people do care about cleaning it up. To put it into perspective, there are about 2,200 city blocks in Manhattan and 3,434 reports in the past year. That's 1.56 reports for every block in Manhattan.